Waves & Beaches at HB06: overview
The HB06 field experiment is one component of the Southern California Coastal Ocean Observing System (SCCOOS). HB06 extends from the shoreline to 60m water depth, and began in June 2006 with deployment of offshore moorings. The portion of HB06 concerned with the surfzone, the area closest to shore where waves break, is described here. Surfzone field observations will take place from about September 5 through October 31, 2006. Collaborators in the surfzone work include Scripps Institution of Oceanography (SIO), Orange County Sanitation District (OCSD), and the Southern California Coastal Water Research Project (SCCWRP). Huntington Beach was selected owing to chronic water quality problem and extensive observations previously collected there.
California beaches, extensively used for recreation and tourism, are sometimes impacted by poor water quality and erosion. Management decisions can depend on accurate characterization of the waves and currents that transport pollutants and sediment very close to the shoreline. However, currents within about 2 km of the shoreline cannot be observed with the SCCOOS HF radars that measure currents over large parts of the continental shelf. Long-term observation of breaking-wave driven currents with instruments in the surfzone (region of breaking waves within a few 100 m of the shoreline) requires expensive maintenance, precluding direct monitoring of currents on more than a few beaches. Models are a cost-efficient alternative to direct observation.
One goal of the surfzone portion of HB06 is to obtain observations of breaking-wave driven alongshore currents for a month at Huntington Beach, and to use those observations to validate and calibrate a model that can be applied routinely to predict real time alongshore currents in the surfzone at Huntington Beach and other nearby sandy beaches. Real-time estimates of waves and alongshore currents for beaches in San Pedro Bay (Ventura County Line to Palos Verdes Point), and Santa Monica Bay (Palos Verdes Point to Dana Point) will be available to the public. These estimates could be used by beach managers, sanitation districts, and county health agencies to estimate the alongshore direction (up- or down-coast) and speed of surfzone water parcels (exiting the Santa Ana River, for example). A related goal is to better understand how breaking waves mix surfzone waters, a process that determines the dilution of pollution. Tested and calibrated surfzone transport and mixing models could be important tools for managing beach closures in Southern California. There are two steps in modeling surfzone currents. As described below (Waves: Buoy Observations & Models), the properties of waves approaching the study beach are first predicted. Next, specialized models (see Surfzone Waves & Currents) are used to simulate wave breaking and the generation of surfzone currents. The surfzone field observations are reviewed in Experiment Description.
A second goal of the nearshore component of HB06 is to study the spatial distribution of phytoplankton and nutrients. Biological processes are controlled by the physical environment, including internal waves, wind, breaking waves, and surfzone currents. However their relative importance in, for example, delivering nutrients to the beach, is not understood. This study will use observations of waves, currents, and temperature to create an integrated view of chlorophyll and nutrient distributions in the nearshore. Biological sampling will include mapping chlorophyll (proxy for phytoplankton) distribution with a new and unique jetski sampling platform, sampling the chlorophyll vertical distribution continuously at a fixed mooring, small boat vertical sampling of CTD/chlorophyll/nitrate, and water bottle sampling for chlorophyll and nutrients.
Waves: Buoy Observations & Models
CDIP (Coastal Data Information Program) has for a decade produced regional estimates of ocean swell (generated by distant storms) for Southern California using a model initialized with a wave buoy near Harvest Platform (station 071 in Figure 1), located seaward of the Channel Islands and directly exposed to waves propagating from the open Pacific towards California. These observed deep water spectra are transformed numerically, through the complex island bathymetry, to coastal locations, close to the shoreline but well seaward of the surf zone. As part of HB06, improved estimates of coastal waves are being obtained using a "network" wave model that concurrently uses multiple buoys in the surrounding CDIP and NDB (National Data Buoy Center) wave observation networks. Swell estimates use 3 offshore buoys, and locally generated wind seas are estimated using 4 nearby shallow water buoys (Figure 1). The CDIP wave prediction scheme (used in the predictions of surfzone currents) has been modified to this network approach, yielding estimates of wave conditions seaward of the surf zone at Huntington Beach (10m depth), with high alongshore spatial resolution (100m).
Surfzone Waves & Currents
Another numerical model simulates wave shoaling and breaking between 10m depth and the shoreline, and the associated generation of alongshore currents in the surf zone. Model accuracy is degraded by irregular or poorly known bathymetry, and by errors in the estimated incident waves. Currents driven by local winds and alongshore pressure gradients can be readily included in the model, and will be included operationally when the required real time estimates of winds and gradients are available. Detailed wave information in 10 m depth, and for the surf zone, will be available in real time on the Internet, updated every hour. A beta version provides near real time (updated every 3-hr) predictions of breaking wave height and surfzone-averaged alongshore currents for a 50km reach of the Southern California coastline from San Diego to San Clemente http://cdip.ucsd.edu/models/cocmp/nearshore/waves+currents. In the example (Figure 2),
wave heights are small, and the weak (<20cm/s) alongshore currents change sign several times.
Detailed, near real-time predictions of breaking wave height and surfzone-averaged alongshore currents for are now available every 100m for a 5km alongshore reach at Huntington Beach (Figures 3 and 4). Observations collected during the HB06 field experiment will be used to test and calibrate the model. The model predictions, driven with network wave models, will continue after the validation study (HB06) concludes. We are expanding these model predictions to Santa Monica and San Pedro Bays.
Experiment Description
The surfzone component of the experiment will be conducted on and offshore of Huntington State Beach Park between Magnolia and Brookhurst Streets (Figure 5).
Fixed Instruments: Fixed wave and current measuring instruments will be located in a region spanning 1 km alongshore and 450 m cross-shore (Figure 5). Pressure sensors, temperature sensors and current meters will be mounted on 7 tripod frames anchored to the sea bottom and deployed on a cross-shore transect between the shoreline and about 4-m depth (Figure 5B). Four additional sea bottom-mounted instrument packages will be placed in an alongshore array in about 2 m depth. The four fixed instruments located away from the main transect will contain internal recording data acquisition systems that are periodically serviced by divers, and the main transect will be cabled to a shore station box (Figure 7). The shore station box will be mounted on pipes jetted into the sand and will contain batteries to power the instruments and the electronics to collect the data and transmit it back to the office/data acquisition trailer located in the parking lot backing the beach (Figure 5a). Instrument locations will be marked by fiberglass poles and/or flags that protrude above the water surface (Figure 6).
Chlorophyll and Dye Studies: A unique jetski sampling system (Figure 8) has been developed to create near-synoptic maps of dye (Rhodamine), chlorophyll (phytoplankton), and temperature in the surfzone. This jetski system is based upon an existing jetski bathymetry surveying system (Figure 9). The jetski sampling system includes GPS (global positioning system) to fix the jetski location, a boom with two water intakes for sampling, temperature sensors, and fluorometers for measuring fluorescence (dye or chlorophyll concentrations). The jetski can sample at speeds of 4-5 m/s. Five stand-alone fluorometers (measuring dye concentration, chlorophyll concentration, and optical backscatter) will also be deployed on the main transect of fixed instruments. Dye and chlorophyll studies will be conducted approximately 4 days per week over a 4-week period. During the dye experiments, dye will be released continuously for several hours. Data sampling will begin when the dye is released (early morning), and continue during daylight hours. Rhodamine, an EPA approved dye for use in groundwater, lake, and ocean work, will be used in all dye work. Bottle samples of dye and chlorophyll will be obtained by OCSD and SCCWRP staff.
Beach and Bathymetric surveys: Surveys of the beach and bathymetry, using survey instruments shown in (Figure 9), will be conducted approximately once per week throughout the experiment.
Surfzone Drifters: On about 8 days during the month-long surfzone deployment, 10 surfzone drifters will be repeatedly released, retrieved, and reseeded along the 1 km-long stretch of beach (Figure 10). The drifters use GPS to track their location, and follow the water, the surfzone circulation.

Figure 1: Network model for Huntington Beach area uses exposed offshore buoys for swell (NOAA46086, 133, 067, 071), and nearby buoys for locally generated seas (045, 096, 092, 028). The Huntington Beach buoy, used to validate the network model near the HB06 field site, is also shown.

Figure 2: Predicted (real time) alongshore currents in the surfzone between the Scripps and San Clemente Piers, 14 Aug 2006.

Figure 3: Real time predictions of average alongshore currents in the surf zone for a 5km stretch of Huntington Beach http://cdip.ucsd.edu/hb06: (top) weak currents (~20 cm/s) on 7/28/06, and (bottom) moderate currents (~50 cm/s, about 40km/day) on 7/29/06.

Figure 4: Time series of (top) average surfzone alongshore current and (bottom) breaker height at transect OC478, the location of the HB06 main transect (Figures 3 and 5). A downcoast current pulse on 07/6 is driven by locally generated wind seas arriving from the northwest. The dominant upcoast (northerly) flow is driven by longer swell arriving from the southwest.


Figure 5: Plan(A) and cross-section (B) views of fixed surfzone instrument.

Figure 6. Tripod frames for instruments in cross-shore array.
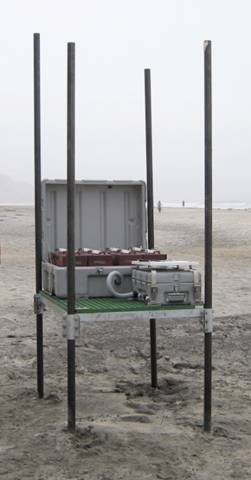
Figure 7. Shore station box.

Figure 8: GPS equipped, dye-sampling jetski. Dye concentrations are measured in samples pumped from two levels (20 and 60 cm) below the ski. Right panel shows spreading of sequentially released dye patches.

Figure 9. Tools used to survey beach sand levels. JetSki will also be used to sample dye and chlorophyll.


Figure 10. Surfzone drifter recovery.